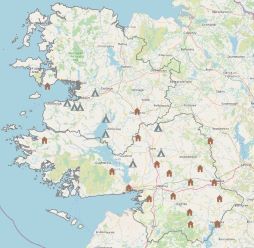
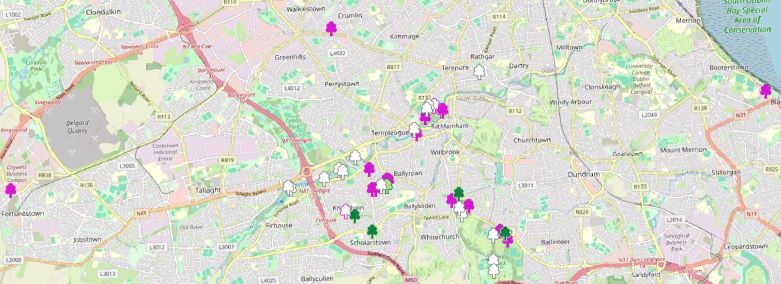
Street Art Fingal
While looking for a project to create a map for this assignment, I came across adataset on Data.gov.ie for data
relating to street art in Fingal, Co. Dublin.
Fingal Street Art Project
Within the dataset the co-ordinates, Artist, Location, Year of installation and a link to the picture were recorded. To create the map, I downloaded
the shapefile and photos. I saved the photos in an images folder within the project. Some of the photos had the surrounding area capture.
In order to save space, I resized the photos to focus on the individual feature photographed. Where there were other street
architecture adjacent to the painted one, I left them remaining within the frame.
In my opinion this is a really fun dataset on Data.gov.ie. In my local area, we have some of these painted electricity supply boxes,
I feel they add a bit of joy and colour to the neighbourhood. They also provide a canvas for artists to display their art.
Street Art Fingal
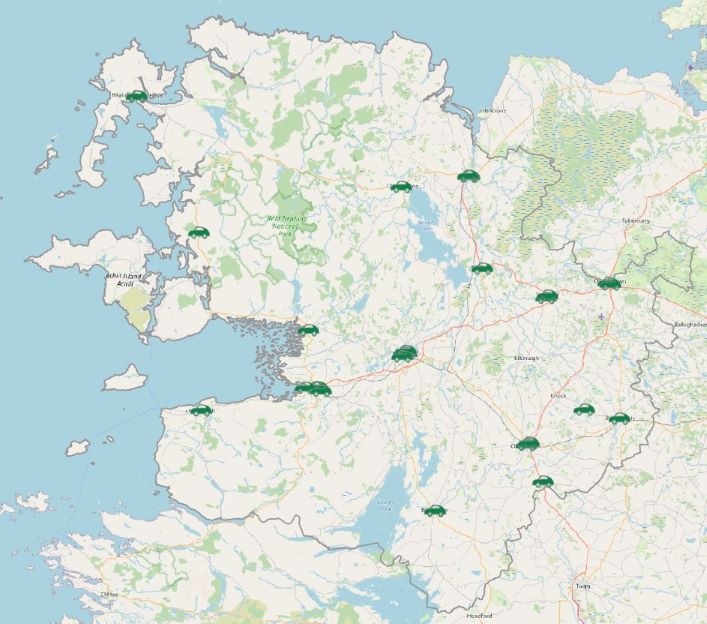
Electric Car Charging Locations Co. Mayo
To create this map, I used the Quick OSM feature in QGIS. I used the tool to search for car charging facilities in Ireland. I created a subset of the data, just
displaying the electric car charging facilities in Mayo.
The resulting shapefile contained a lot of NULL values which maybe were not relevant to an Irish dataset. I deleted these NULL values from the data.
To create a map which the user might find useful, I chose to display the operator of the charger, the name, whether
there was a fee for using the charger and the available access.
Electric Car Charging Locations Co. Mayo
About me
I have been working for Inland Fisheries Ireland (IFI) since 2002 on a number of projects, including monitoring fish
and plants on OPW arterially drained channels and water sampling on the canals and waterways of Ireland.
I joined the Habitats Directive and Red Data Book species team in 2009. My role within this team is monitoring the
3 lamprey species, Twaite shad and Pollan. Within this role we use numerous techniques to monitor these species,
these include electro fishing, netting, eDNA, lamprey spawning surveys, shad egg surveys.
My role within the team involves participating in all aspects of field survey monitoring and collection of data.
My speciality is providing the GIS support to the team, with the creation of species density,
distribution and range maps for the team. This year, 2024, is a reporting year. I am largely self taught in GIS
which is why I enrolled in this course. In my role within IFI this is my third reporting cycle - 2013, 2019 although
the reporting has changed vastly for this cycle, so as a team we are currently reading through all the relevant
literature supplied by NPWS and the EU.